Rental prices 2016–2026: the Hungarian rent index trend | RentTab
RentTab · Published: 22 July 2026
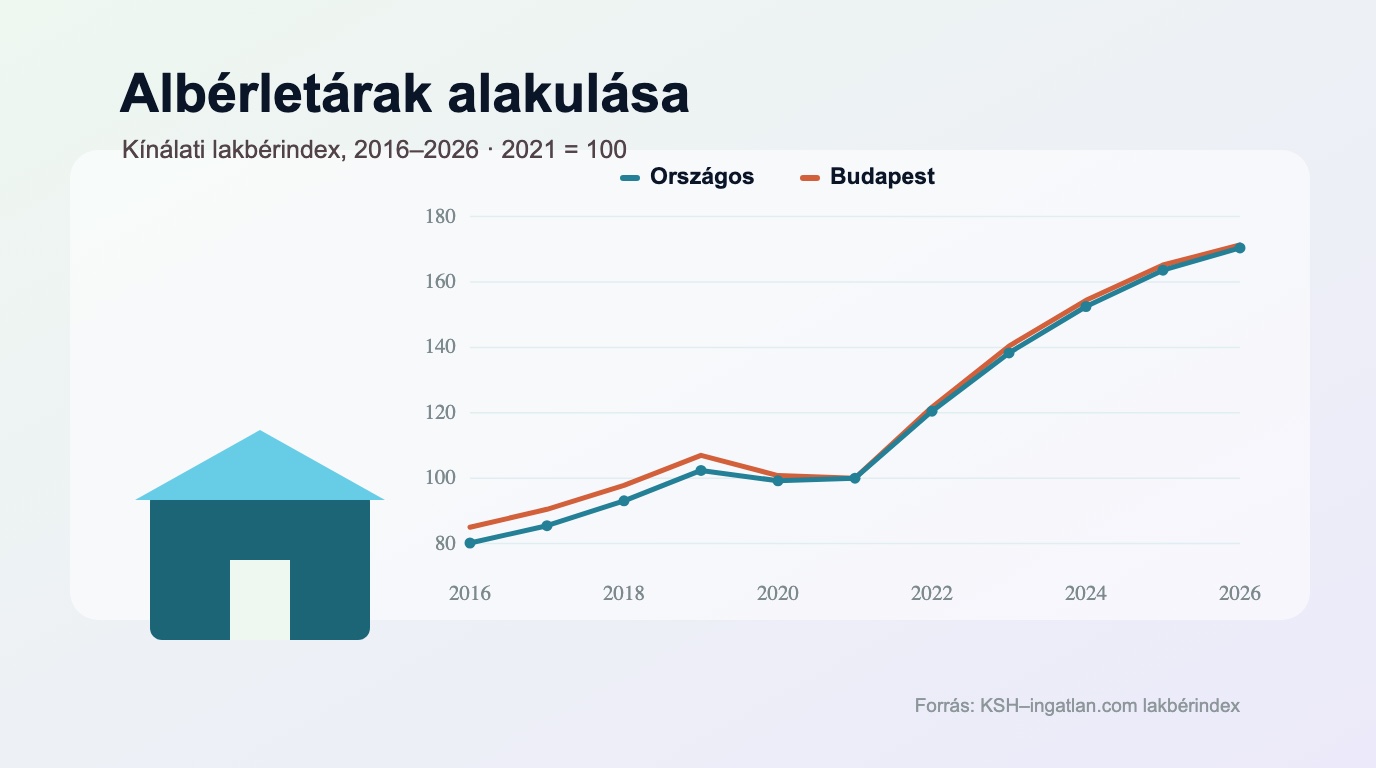
Hungarian rental prices have more than doubled since 2016: per the KSH–ingatlan.com rent index, asking rents by mid-2026 were about 112% higher nationally than in 2016, and 73% above the 2021 base. But the pace of growth slows year by year — after the ~+20% peak in 2022, only ~4% in the first half of 2026. The chart below shows the full trend. (The data is Hungarian; adapt to your market.)
The rental price trend
What does “2021 = 100” mean? It’s a reference point: we set the average 2021 rent to 100 and measure every year against it. So the 2026 value of 170 means the price level is 70% higher than in 2021; the 2016 value of 80 means it was 20% lower back then. It’s not a forint amount but the size of the change — which lets you compare years and regions.
Asking rent index, 2016–2026
Yearly average, 2021 = 100. Source: KSH–ingatlan.com rent index.
* 2026: first-half average. The index tracks asking (advertised) rents.
Yearly change: fast rises, then a slowdown
The trend splits into three phases:
| Year | National index | Yearly change | What happened |
|---|---|---|---|
| 2016–2019 | 80 → 102 | +6–10%/yr | Steady, strong rises |
| 2020 | 99 | −3% | COVID: a dip |
| 2021 | 100 | +1% | Base year, flat |
| 2022 | 121 | +20.5% | Record-pace surge |
| 2023 | 138 | +14.8% | Slowing after the peak |
| 2024 | 153 | +10.2% | Slowing further |
| 2025 | 164 | +7.3% | Moderating pace |
| 2026 (H1) | 170 | +4.2% | The lowest pace in years |
The takeaway: the price level is at a historic high, but the pace of growth has been falling for years — in 2026 the wide, accumulated supply is braking the rise.
Why is the rise slowing?
- Supply: many flats reached the rental market in recent years — ample supply holds back price growth.
- Affordability ceiling: the gap between wages and rents strains demand, capping prices.
- Buying alternatives: if home-buying picks up, rental pressure eases.
Short-term, month-to-month moves are also shaped by seasonality (a summer–school-start peak) — covered in detail in rental price trends.
Where RentTab helps
The market index is a good benchmark, but your decisions need your own numbers. RentTab records rent, fees and utilities per property, so at year-end you see the actual income and net yield precisely — from your data, not an estimate.
Frequently asked questions
How much have Hungarian rents risen since 2016? Per the KSH–ingatlan.com rent index, asking rents have more than doubled since 2016; versus the 2021 base, +73% nationally by mid-2026.
When was the biggest rise? In 2022, when the annual pace was about +20% nationally. Since then the pace has slowed year by year.
Are rents falling now? The price level isn’t falling; only the pace of growth is slowing: ~4% year-on-year in the first half of 2026, the lowest in years.
Where does the data come from? From the KSH–ingatlan.com rent index (2021 = base), published monthly by KSH and ingatlan.com since August 2020.
Sources
- KSH–ingatlan.com rent index, June 2026 (time-series appendix, 2021=100) — ksh.hu
- KSH housing statistics (overview) — ksh.hu/lakas